2026-08-18 · Updated 2026-10-01
How to monitor an MCP server
- mcp
- monitoring
- agents
- uptime
The endpoint answers HTTP, so it is tempting to point a monitor at it, watch for a 200, and call it done. That check keeps passing while the server returns an error to every tool call, while it advertises an empty tool list because a config file failed to load, and while it answers with a protocol version none of your agents can negotiate. In each case a socket answers and the server is unusable.
TL;DR
Point an HTTP monitor at the MCP endpoint, POST a JSON-RPC
initializerequest, sendAccept: application/json, text/event-stream, and assert the body containsprotocolVersion. That is a single request and it needs no session.
Why the port tells you nothing
Streamable HTTP, the transport every remote MCP server uses today, puts everything on a single endpoint that handles both POST and GET. That is convenient to deploy, and it means the URL you would instinctively curl is not the one doing the work.
A GET against that path can return a 200 from a load balancer, from a health handler mounted alongside, or from a container that started but never finished wiring up its tools. None of those paths touch JSON-RPC, so the monitor reports green while the product is down.
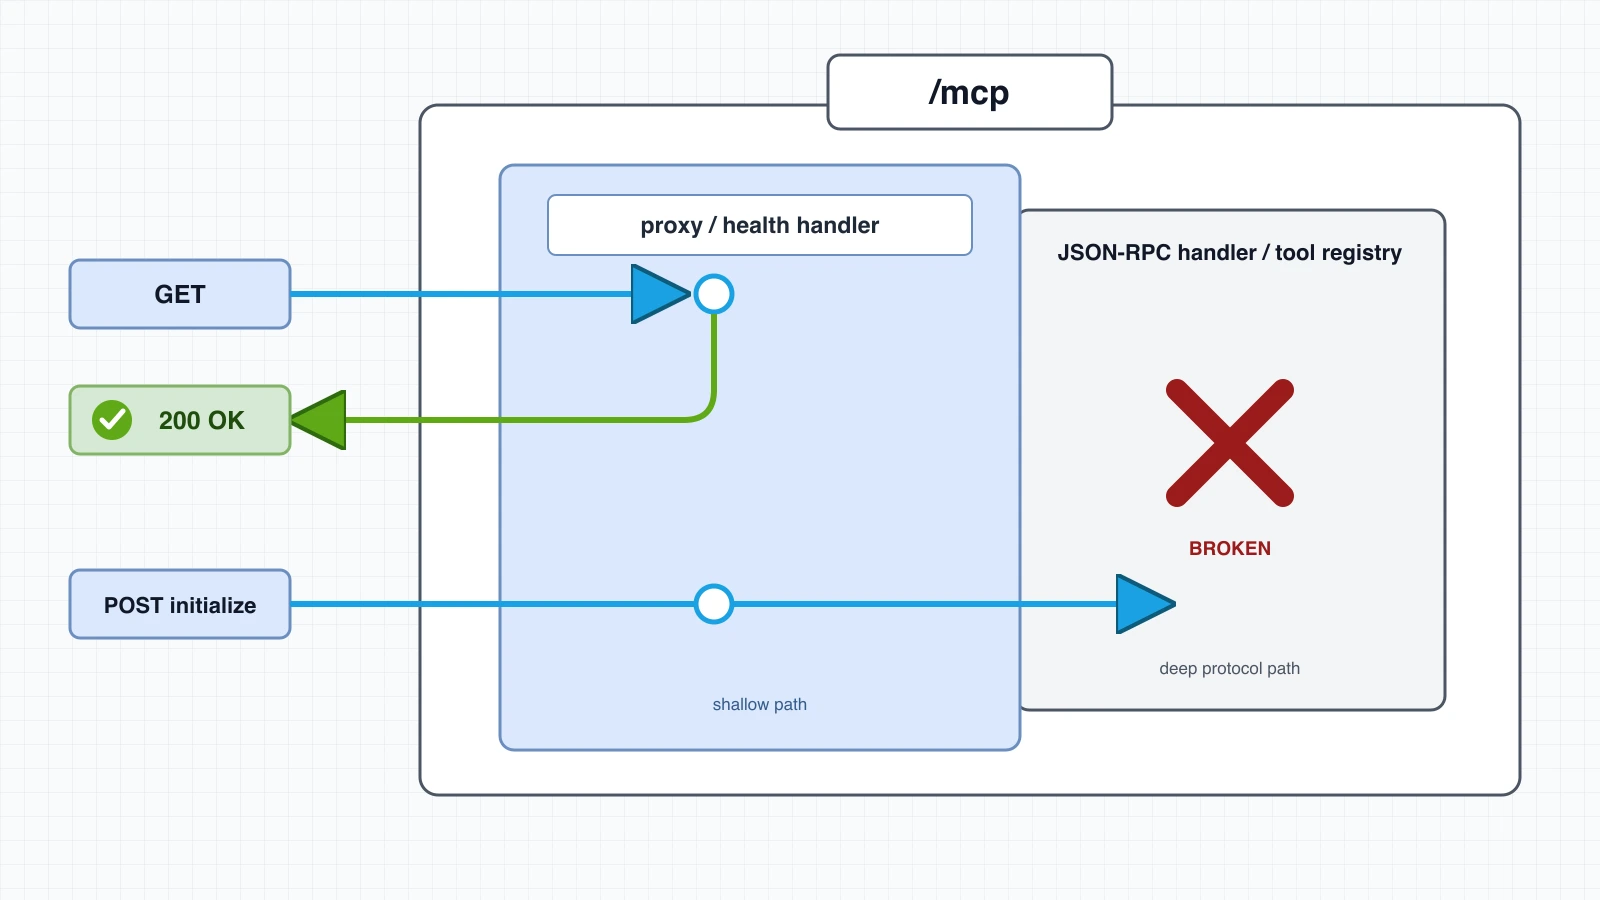
It is the same failure as monitoring a login page instead of the login, where the page renders correctly and the thing behind it does not work.
The smallest probe that proves something
The handshake is the check, and it fits in one POST:
Send it to the MCP endpoint with these headers:
HTTP/1.1A healthy server replies with a JSON-RPC result carrying protocolVersion, capabilities and serverInfo. Assert that the body contains protocolVersion and you have proven the server parsed JSON-RPC, recognised the method, negotiated a version and described itself. A dead tool registry, a broken config, a version mismatch or a crashed backend all fail that assertion, and a 200 from a proxy never satisfies it.
Where it goes wrong
The Accept header is the usual reason a first attempt fails. The spec requires clients to list both application/json and text/event-stream on every POST, and a server that follows it will reject anything offering only JSON. That is an afternoon spent debugging a monitor instead of a server.
The response might not be JSON at all. For any request the server may answer with a single JSON object or open an SSE stream, and clients have to handle both. When it opens a stream the body arrives as event: message followed by a data: line wrapping the same payload. So the assertion wants a substring like protocolVersion that survives both shapes. Matching on a body that starts with {"jsonrpc" will make the monitor flap according to which branch the server happened to take.
Probe with initialize rather than tools/list. initialize is valid with no session because it is what starts one. Stateful servers hand back an MCP-Session-Id header and answer later sessionless requests with a 400, so a monitor firing tools/list by itself reports a hard failure against a healthy server.
Repeated handshakes can also leak sessions. A server that allocates state on initialize and expects an HTTP DELETE to release it will accumulate one session per probe. Most implementations expire them on a timer and it never comes up. If yours does not, probe less often, or find out whether the server exposes a cheaper liveness path.
Setting it up in Uptimepage
An HTTP monitor with the method set to POST, the two headers above, the JSON body, expected status 200, and protocolVersion as the expected body content. In Terraform:
Same shape through the API, or through our own MCP server, which can create the monitor and bind it to a notification channel you already have. How that works covers what it will and will not touch.
If the server is behind OAuth
Remote MCP servers increasingly sit behind OAuth, ours included. That gives you two checks, and they catch opposite failures.
Send a bearer token and assert the handshake succeeds, and you are testing what your agents actually do. Send nothing and assert a 401, and you are testing that the guard is still there. The second sounds paranoid until a deploy drops the auth layer and an internal tool server starts answering the internet. Nothing else in your monitoring will notice, because from the outside a server that stopped requiring auth looks healthier than one that still does.
Keep the token in a secret rather than in the monitor body, and rotate it like any other credential.
What to alert on
Handshake failure is a real outage, because agents cannot use the server at all. Alert on it the way you would alert on an API returning 500s.
Latency is worth watching separately. The initialize round trip is a floor under every agent interaction with that server, and an agent that waits three seconds to find out which tools exist has spent the user's patience before doing any work. Trend it and treat a slow drift as an early warning.
What an uptime check cannot tell you is whether the tools return the right answers. That needs a real call with a known input and an expected result, which is a different and more expensive kind of check.
Common questions
How do I check that an MCP server is up?
Point an HTTP monitor at the MCP endpoint, POST a JSON-RPC initialize request, send Accept: application/json, text/event-stream, and assert the body contains protocolVersion. That is the smallest exchange proving the server speaks MCP rather than merely holding a socket open.
Why is an HTTP 200 not enough to monitor an MCP server?
A GET against that path can return a 200 from a load balancer, from a health handler mounted alongside, or from a container that started but never finished wiring up its tools. None of it exercises JSON-RPC, so the check passes while agents cannot use the server at all.
Should I probe with initialize or tools/list?
initialize is valid with no session because it is what starts one. Stateful servers hand back an MCP-Session-Id header and answer later sessionless requests with a 400, so a monitor firing tools/list by itself reports a hard failure against a healthy server.
Why does my MCP monitor fail with a 406 or 400?
The spec requires clients to list both application/json and text/event-stream on every POST. A missing or narrower Accept header is the usual cause. The other one is an MCP-Protocol-Version header naming a version the server does not support, which the spec requires it to reject with 400.
How do I monitor an MCP server that requires OAuth?
Send a bearer token and assert the handshake succeeds, and you are testing what your agents actually do. Send nothing and assert a 401, and you are testing that the guard is still there. Running both catches a server that is up but has quietly stopped requiring auth.