2026-11-13
A 4.5 GB browser tab, an htmx leak and a measurement that lied
- htmx
- javascript
- debugging
- performance
- rust
TL;DR
A browser tab with my dashboard open reached 4.5 GB. I measured the page and saw memory grow by about 100 KB on every poll. That number explained the tab almost perfectly, and it was wrong: the growth came from the debugger I measured with. Without it, the page stayed flat. The real leak was smaller and stranger. Each response started with a newline, and htmx keeps that newline when it swaps the element out. A 5 second poll left 17,280 text nodes a day. The fix was a template trim and a test.

The lens made the memory look full. The real leak was the slow drip below it.
The Uptimepage dashboard is a page people leave open all day, on a second screen or a TV in the office. It refreshes itself with htmx: every 5 seconds it asks the server for the monitor table and swaps the new table in.
Then one browser tab with that dashboard reached 4.5 GB of memory. I opened the page in an automated browser to find the leak.
The perfect suspect
I used Playwright with Chrome. To see a trend in minutes and not in days, I made the page poll much faster than every 5 seconds. Then I read the memory of the tab's renderer process, the process that runs the page.
The line went up. Every poll added about 100 KB. Each response was 57 KB of HTML, so it looked like the page kept a copy of every response it had ever received.
The numbers fit. The dashboard polls 17,280 times a day. At 100 KB per poll that is about 1.7 GB a day, so a tab would pass 4.5 GB in less than three days. I had a suspect and a timeline.
Before I blamed htmx, I ran the same page once more, this time with no debugger attached.
The twist: the measurement was the leak
To show it here, I rebuilt the page as a small test with the same 57 KB response and ran both cases side by side for 15 minutes.
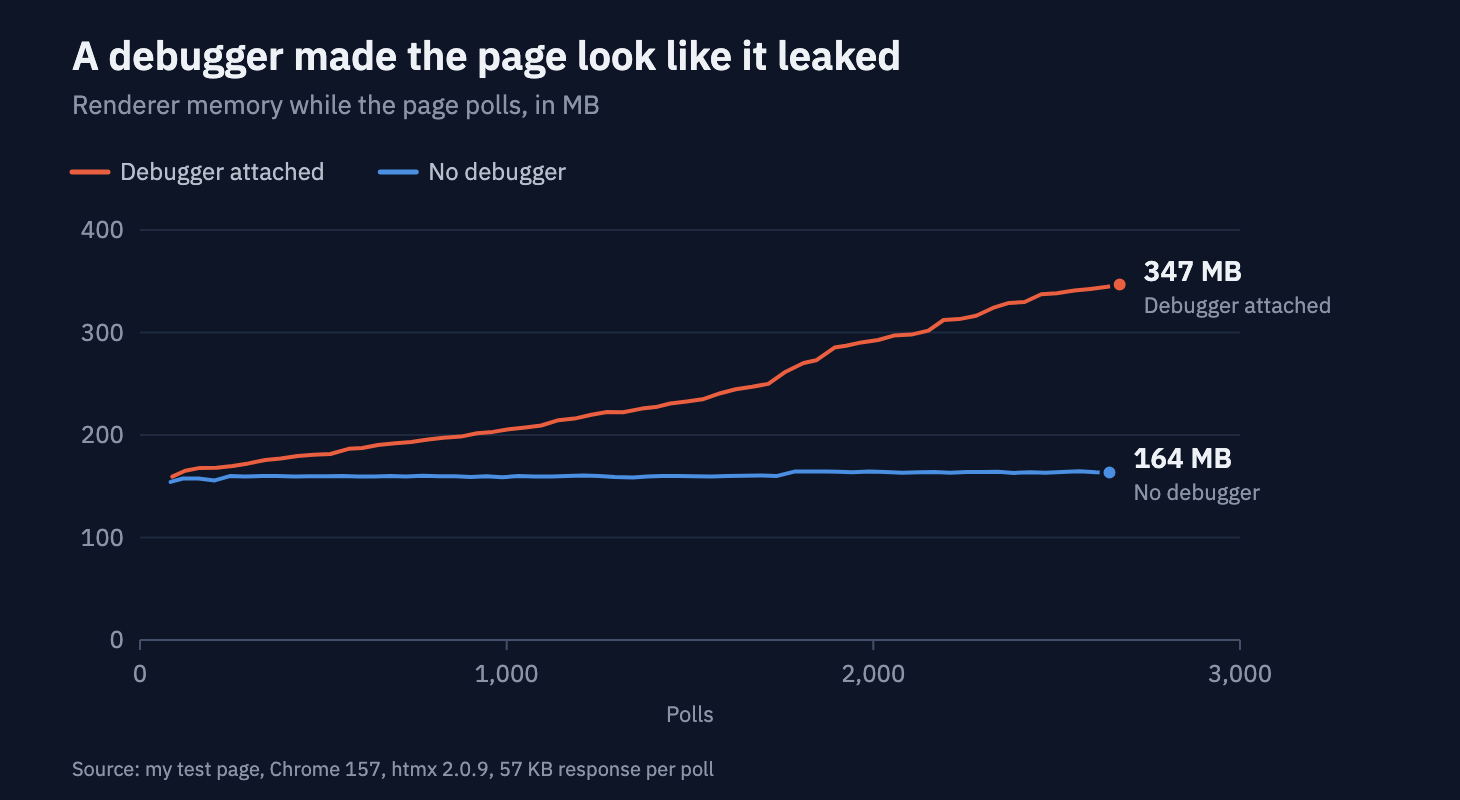
The rerun on Chrome 157. With the debugger, memory grew about 70 KB per poll on average and was still growing when the run ended.
Both browsers ran the same Chrome, the same page and the same 57 KB response at the same speed. The only difference was one connection. In one browser a client was attached through the Chrome DevTools Protocol with the Network domain turned on. Playwright and Puppeteer turn it on when they connect, and a browser extension that uses the debugger API can turn it on too. In the rerun, the client only turned on the Network domain. Every 15 seconds it also asked for the first response body, to check that it was still there.
Without the debugger, the renderer stayed between 154 and 164 MB. With it, memory grew on every poll, from 159 MB to 347 MB in 2,672 polls.
Chrome does this on purpose. When a client enables the Network domain, Chrome keeps response bodies so the client can ask for them later with Network.getResponseBody. The protocol documentation describes the buffer as the place for "preserving network payloads (XHRs, etc)". I checked it directly. After 2,600 polls, the body of the very first response was still there, all 57,152 characters.
The buffer has a ceiling. In Chromium's source the default is 200 MB of bodies on desktop, and Chrome drops the oldest bodies once it is full. My run ended at about 150 MB of bodies, below that line. So most of that slope stops at the ceiling, and a debugger alone is unlikely to take a tab to 4.5 GB either.
So the slope I found came from watching the page. Without the watcher, the page stayed flat. A memory number read with a debugger attached includes that buffer. You can still count objects under a debugger, but you cannot trust its bytes per request.
The suspect had an alibi. The tab had still reached 4.5 GB, so I kept looking.
Counting nodes instead of bytes
Bytes had misled me once, so I counted things. A page can count its own DOM with a TreeWalker. This needs no debugger, so nothing else changes the result:
I ran it, waited for a few polls, and ran it again. The count went up by one on every poll. To find where, I grouped the nodes by their parent. One parent stood out: a <section> around the polled element. It gained one child per poll, and every new child was a text node with a single character: a newline.
On a busy page the total can also move for other reasons, because rows come and go between polls. The parent of the polled element is the cleaner place to look. Its child count should never change:
...;
Look the element up again each time. The swap replaces it, so a reference saved before the swap points at a node that is no longer on the page.
Use childNodes, not children. The leaked nodes are text nodes, and children counts only elements.
You will not see them in DevTools. The Elements panel hides text nodes that hold only whitespace, and the browser draws nothing for them between block elements. The page looked perfect while it grew.
On the test page I made two versions of the response, with htmx 2.0.9 and a polled element swapped with outerHTML. One version sent a newline before the element. The other sent the same response trimmed.
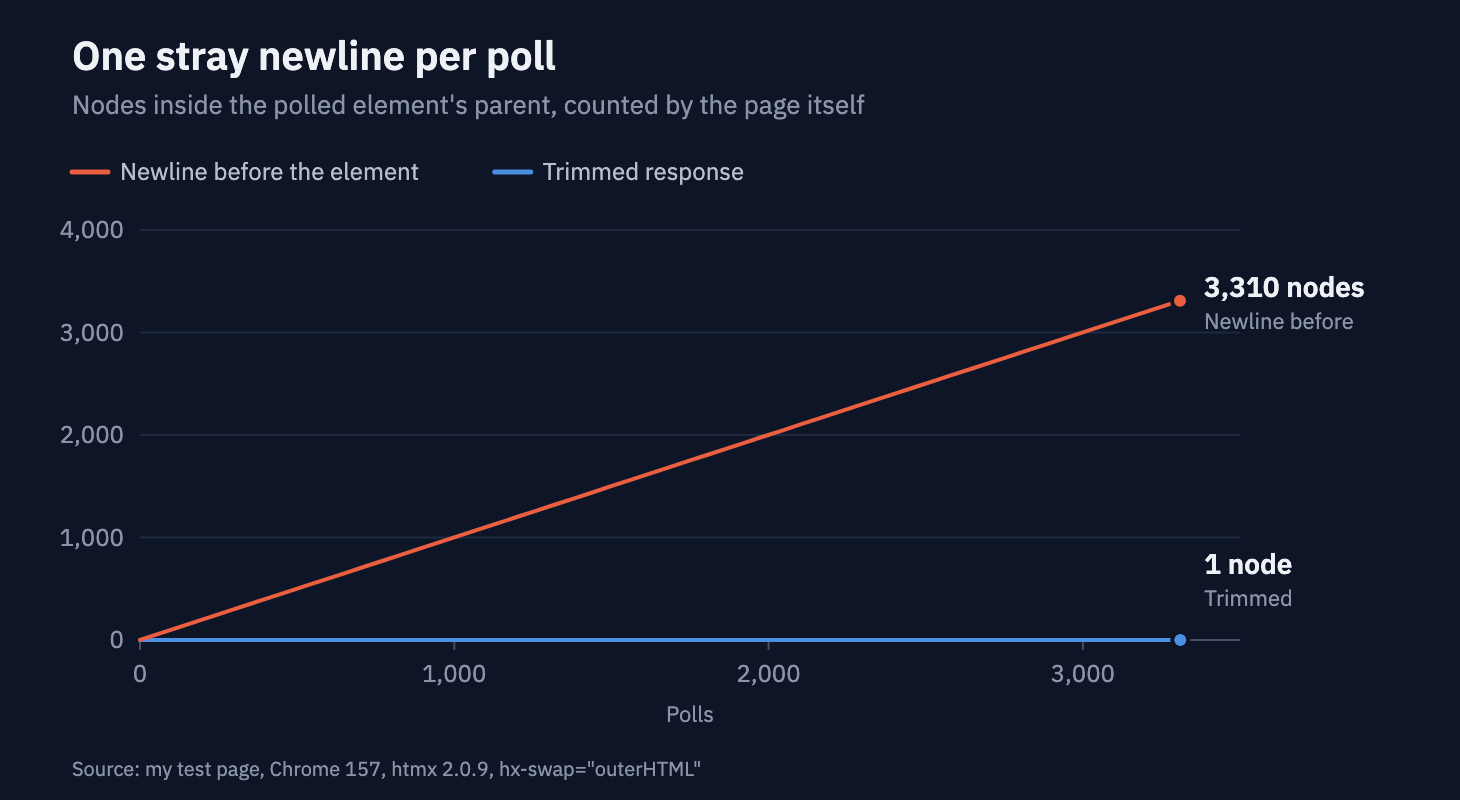
Counted by the page itself, with no debugger. The leaky version gained exactly one node per poll.
Where the newline came from
The table on the dashboard is one element with polling attributes. On every poll the server sends a fresh copy of the whole element, attributes included:
...
The template for that response started with a comment that explained the polling rules. The comment rendered to nothing, but the line break after it stayed. So every response started with \n, then <div.
hx-swap="outerHTML" replaces the element itself, not its content. In htmx 2.0.9, the swap works in two steps:
- Insert every node of the response before the old element.
- Remove the old element.
Step 1 inserts two nodes: the newline and the new element. Step 2 removes one: the old element. The newline stays in the parent, next to the newline from the poll before.
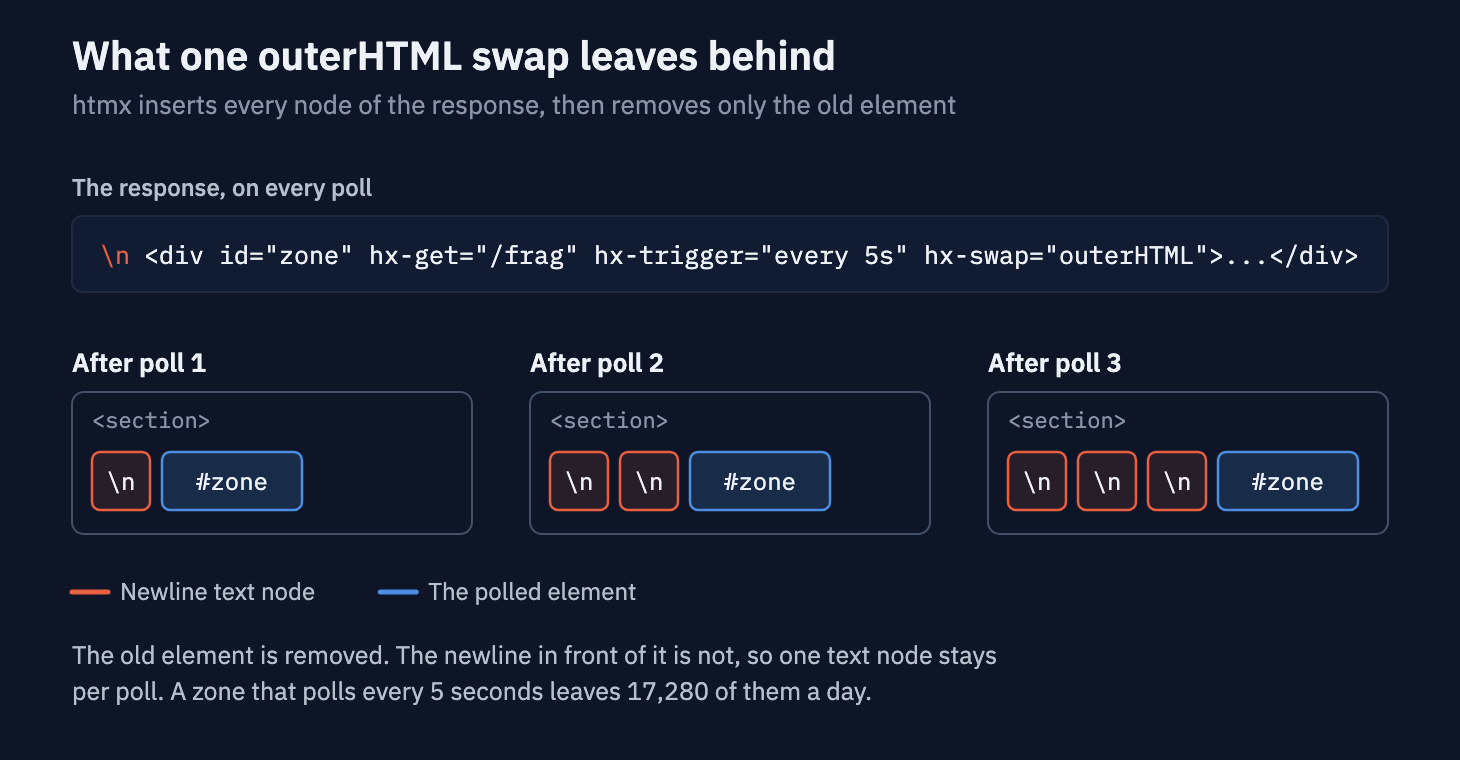
Each poll adds a newline in front of the zone. Nothing ever removes it.
htmx is not wrong here. The docs say an outerHTML swap replaces the target with the response, and this response had two top-level nodes. htmx inserted both. The same happens with whitespace between the main element and its hx-swap-oob siblings. htmx moves the out-of-band elements to their targets, but the line breaks between them stay in the response and are inserted with the rest. On my monitor detail page that meant more than one stray node per poll.
How much is one newline?
Not much. To put a price on one node, I added a million newline text nodes to an empty page and measured the renderer with no debugger. It used 120 MB more, about 125 bytes per node. At 17,280 polls a day that is about 2 MB a day. At that rate, 4.5 GB would take more than five years.
So a newline per poll does not explain 4.5 GB on its own. I never got a clean browser near that number with this page, before or after the fix. What I could prove was smaller. The page had a leak that never stops, and my first measurement could not be trusted. I fixed the leak and changed how I measure.
A leak this slow still matters on a page that is meant to stay open. Every poll leaves the page a little bigger, and the memory only comes back when someone reloads.
The fix
Trim the template
The response must start with < and end with >. My web UI is built in Rust, and my templates use Askama, a Rust template engine with the same syntax as Jinja. A minus sign next to a tag removes the whitespace on that side:
{# This zone polls every 5 s. No whitespace may surround it:
   an outerHTML swap keeps every top-level node. -#}
<div id="dashboard-table" ...>
Jinja2 uses the same marks on tags and comments, {%- -%} and {#- -#}. Go templates use {{- and -}}, with a space next to the dash. If your engine has no trim marks, trim the response string on the server before you send it.
Test the seams
A trim is easy to undo by accident. Someone adds a comment or a blank line, and the leak comes back with nothing to tell you. So the render test for the dashboard partial checks both ends of the response. A newline on either side fails the build:
let html = partial.render.unwrap;
// An outerHTML swap inserts every top-level node beside the target.
assert!;
assert!;
Partials with out-of-band siblings also check each seam, the place where two top-level elements meet.
Or swap the content instead
If you cannot control the whitespace, put the polling attributes on a wrapper that stays on the page and use hx-swap="innerHTML". An innerHTML swap removes every old child of the target, text nodes included. The server must then return only the content, without the polled element and its attributes. If the response still carries hx-trigger="every 5s", the inner copy starts a second poll beside the wrapper's.
A second trap: pausing polls in a hidden tab
While I was in this code, I also stopped polling in background tabs. A hidden tab shows nothing to anyone, so its requests are wasted.
The obvious htmx way is a filter on the trigger:
hx-trigger="every 5s [!document.hidden]"
htmx turns the text inside the brackets into a function with Function(). My public status pages send a Content-Security-Policy without unsafe-eval, so the browser refuses to build that function. htmx catches the error, fires an htmx:syntax:error event, and keeps the trigger without the filter. The poll then runs every time, hidden tab or not.
I tested it with a filter that is always false, [false], and a poll every 500 ms. Without the policy, the element made 0 requests in a minute. With the policy, it made 117.
So the pause is a small script instead of a filter:
;
;
A polled element opts in with data-poll-pause and adds poll-resume from:body to its hx-trigger. A hidden tab now sends no requests, and the screen refreshes the moment you come back.
What I check now
Count nodes, not bytes, when you look for a DOM leak. The child count of a polled element's parent should be the same after a hundred polls as after one.
Measure memory with no debugger attached. Playwright and Puppeteer are fine for counting objects. Read memory from a separate run without them.
Every response for an outerHTML swap starts with < and ends with >, and a test says so.
Use htmx trigger filters only where eval is allowed: no Content-Security-Policy, or one with unsafe-eval. Or listen for htmx:syntax:error events. Otherwise a filter can stop working and nothing on the page shows it.
The Uptimepage dashboard is meant to stay open for days, which is why one newline per poll was worth a test. If you want a dashboard like that and a status page for your own services, you can start here.
Common questions
Does htmx leak memory when it polls?
Not by itself. In my tests htmx 2.0.9 kept the page flat over thousands of polls. It does keep any node that sits outside the swapped element in an outerHTML response, so whitespace around that element piles up one text node per poll.
Why does memory grow when Playwright or Puppeteer is attached?
They turn on the Network domain of the Chrome DevTools Protocol, and Chrome then keeps response bodies so the client can ask for them later. A page that polls looks like it leaks, but the memory belongs to the debugger session.
How do I find a DOM node leak?
Count the child nodes of the polled element's parent, wait for a few polls, and count again. If the number grows with each poll, something is left behind. Use childNodes, not children, because the leaked nodes are text nodes, and the DevTools Elements panel does not show text nodes that hold only whitespace.
Does hx-swap innerHTML have the same problem?
No. An innerHTML swap removes every old child of the target, text nodes included. The leak needs an outerHTML swap with whitespace or other nodes around the swapped element.
How do I stop htmx polling in a hidden tab?
Cancel the request in an htmx:beforeRequest listener while document.hidden is true, and trigger one refresh on visibilitychange. A trigger filter such as [!document.hidden] also works, unless a Content-Security-Policy without unsafe-eval blocks it or htmx.config.allowEval is off.