2026-11-15
ClickHouse async inserts were not batching, and an HTTP/2 bug blocked the fix
- clickhouse
- rust
- http2
- performance
- postmortem
TL;DR
My uptime monitor writes check results to ClickHouse with async inserts. About three inserts arrived each second, and ClickHouse wrote almost every one to disk alone. With two rollup tables, that made about nine new parts a second, and merging them cost a lot of CPU. A fixed 2 second wait solved it. Two bugs stood in the way first: one in ClickHouse 26.3, and one in the HTTP/2 library my agents use. Now there are 84% fewer new parts, and the server's CPU went from about 77% to about 61%.
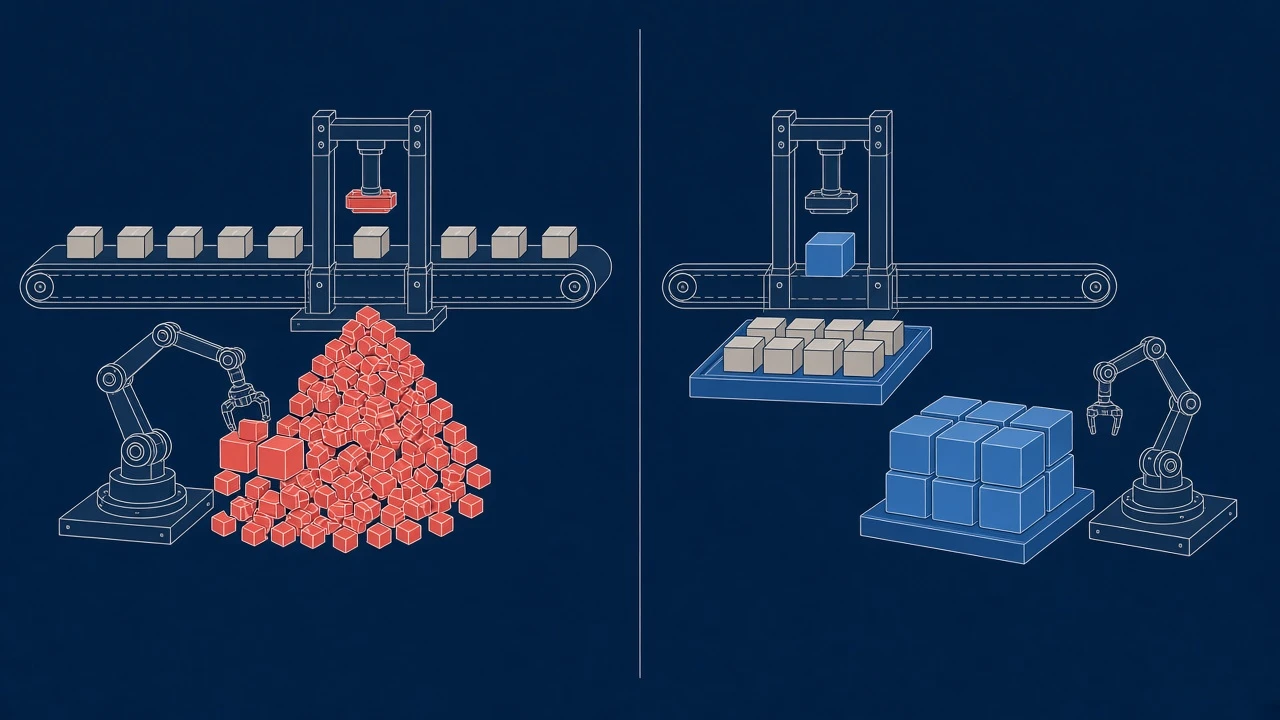
The parcels and the press are the same on both sides. Only the wait before each stamp is different.
Uptimepage checks websites and servers from 13 regions. In each region an agent runs the checks and sends the results to the main server every 5 seconds, in one HTTP POST. The main server writes each POST to ClickHouse as one insert. Its own checks go through a small batcher that writes every half second.
The server's CPU had been at about three quarters for weeks. Nothing was broken, and the number of checks was flat. So the cost came from how I used ClickHouse, not from more work.
Where the CPU went
ClickHouse logs its own work in system tables. system.query_log records every query with the CPU time it used. system.part_log records every part it writes and every merge. I keep both with a 3 day TTL, since they once filled my disk.
A part is the set of files that one insert writes to disk, sorted by the table's key. ClickHouse merges small parts into bigger ones in the background, so that reads have fewer files to open. Merging costs CPU, and the more small parts you make, the more merging you pay for.
Merges were the biggest cost. Reads came second, and writing the inserts came third. The ratio between inserts and parts was the clue:
| Per second | Count |
|---|---|
| Inserts into the results table | 3.2 |
| Async insert flushes of that table | 2.8 |
| New parts on the results table and its two rollups | 8.5 |
Almost every insert was its own flush. And each flush wrote three parts, because two materialized views copy every insert into a 1 minute rollup and a 1 hour rollup. A materialized view runs once for each batch of rows written to the table, so one small insert became three small parts.
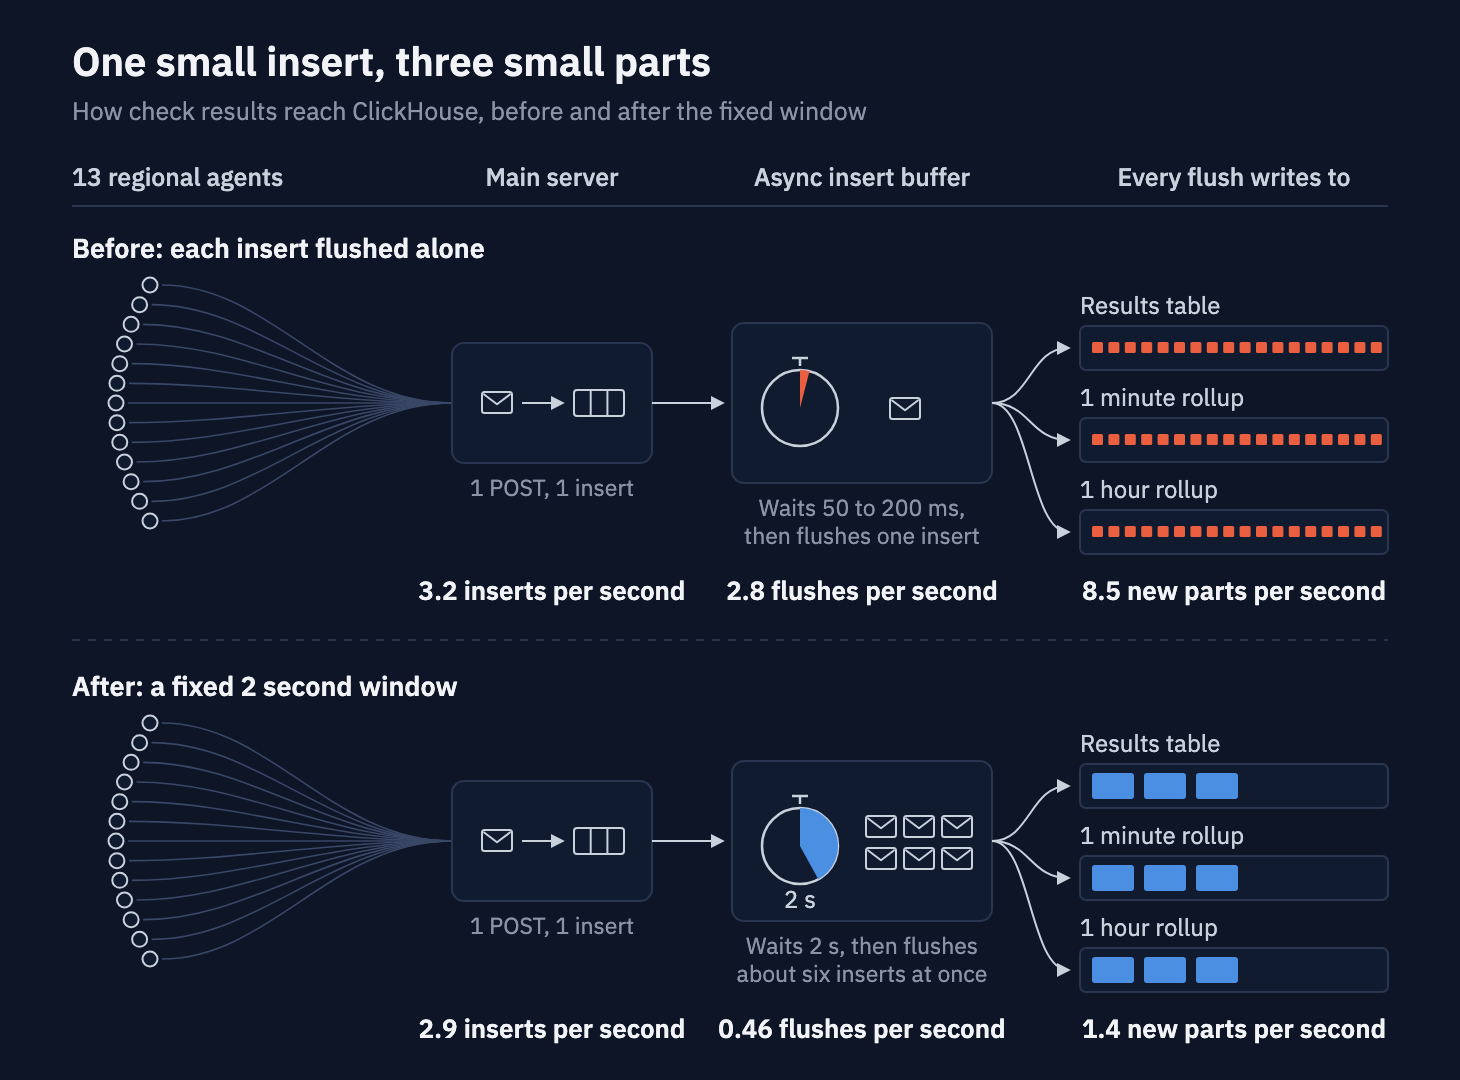
Each flush writes one part to each of the three tables, so the number of flushes sets the number of parts.
Why async inserts did not batch
Async inserts exist for this case. With async_insert=1, ClickHouse does not write a part for each insert. It keeps the rows in a buffer and flushes the buffer when a timer runs out or the buffer is big enough. With wait_for_async_insert=1, the client gets its answer after the flush, so it knows the rows are on disk.
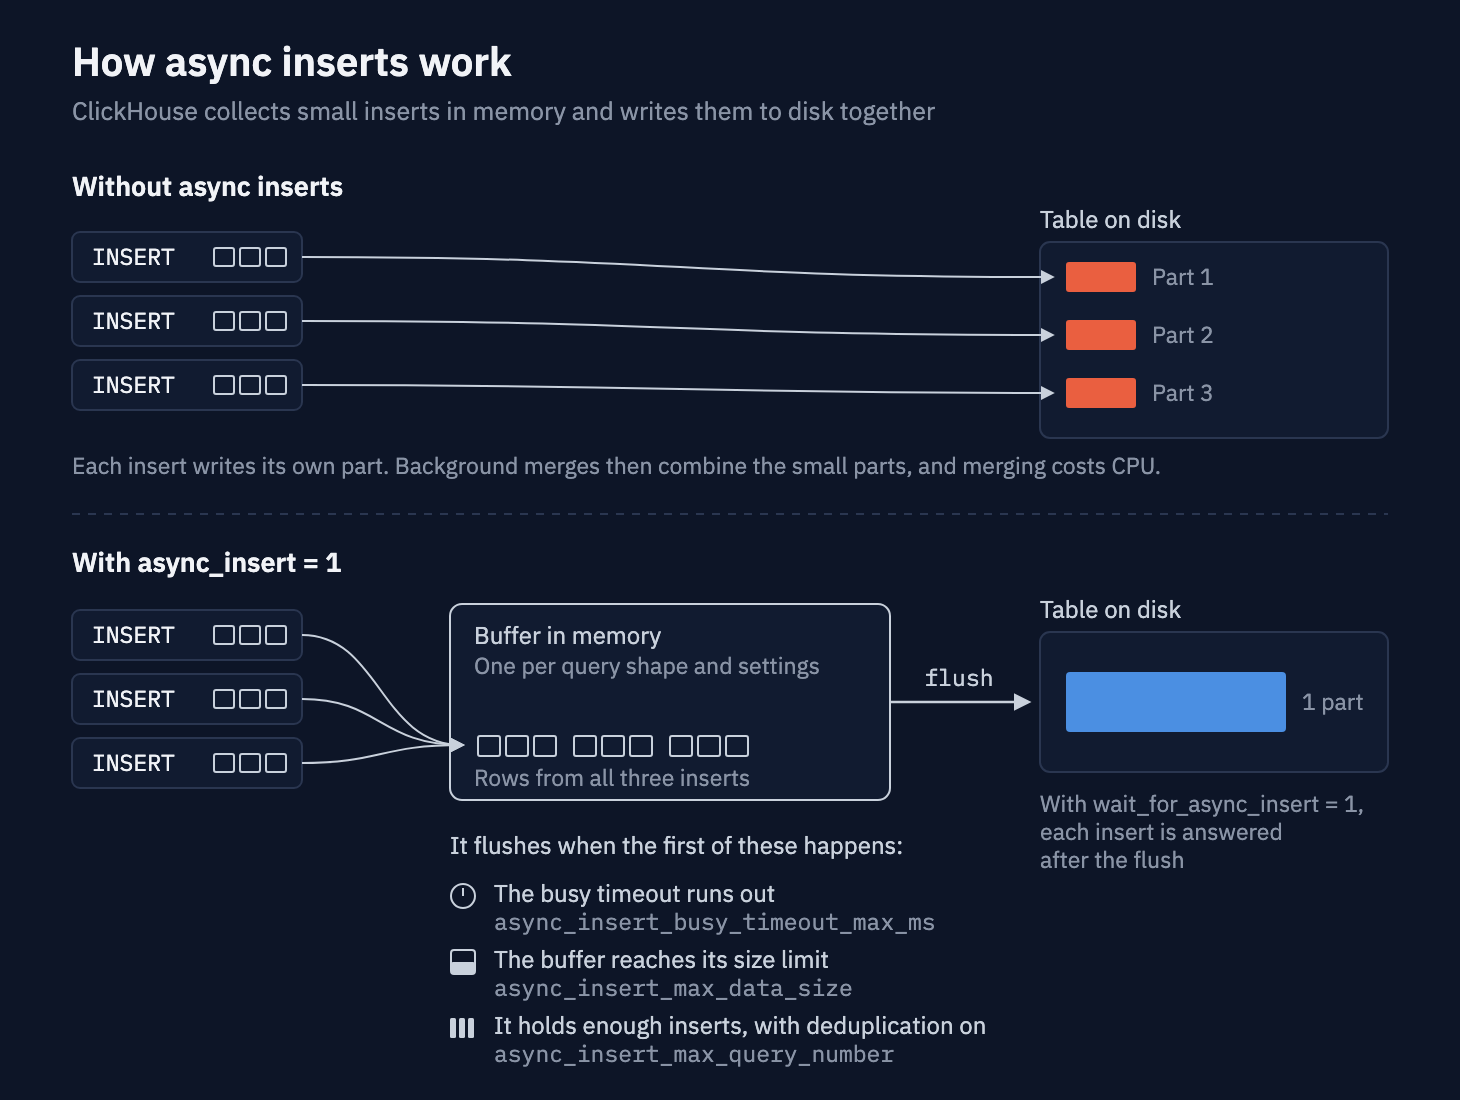
This post is about the first trigger: how long the busy timeout waits.
The timer is the busy timeout, and recent ClickHouse versions adjust it on their own. It starts at async_insert_busy_timeout_min_ms, 50 ms by default, and can grow to async_insert_busy_timeout_max_ms, 200 ms by default on a self-hosted server. It grows only when inserts keep arriving close together.
Three inserts a second arrive about 300 ms apart, which is never close enough. The timer stayed near its minimum, and almost every insert went out in a flush of its own.
Raising the maximum does not change that. I set async_insert_busy_timeout_max_ms to 2000 and left the adaptive timer on. Inserts at about three a second still got their answer after about 100 ms.
To get a real window, turn the adaptive timer off for these inserts. The maximum then becomes a fixed wait:
INSERT INTO check_results
SETTINGS
    async_insert = 1,
    wait_for_async_insert = 1,
    async_insert_deduplicate = 1,
    async_insert_use_adaptive_busy_timeout = 0,
    async_insert_busy_timeout_max_ms = 2000
VALUES (...)
Now the inserts from all agents within 2 seconds share one flush and one part. Each insert waits up to 2 seconds for its answer. Nothing in my system waits on a single check result, so I accepted that.
The error a longer window made likely
I tried the 2 second window on a local ClickHouse 26.3 first, with the test that resends a batch. Some inserts failed:
Code: 49. DB::Exception: Invalid partition key size: 0. (LOGICAL_ERROR)
The trigger is a resent insert. When a client loses the answer to an insert, it cannot know whether the rows landed, so it sends the same rows again. ClickHouse insert deduplication makes that safe. It keeps a hash of recent inserts and skips an insert it has already stored. For async inserts that needs async_insert_deduplicate=1. My rollups depend on it: without it, a retry would count a check twice.
When one flush holds a resent copy of an insert that already committed, together with any other insert, the whole flush fails with that error. The other insert did nothing wrong, and it fails too. Both retry. If the retries land in the same flush again, both fail again. The ClickHouse guide says this should not happen: for async inserts, deduplication works per query, "so a duplicate query does not discard the other queries batched with it".
Locally, a resent batch and a new batch failed together 14 times over about 12 seconds, until retry timing put them into separate flushes. The final row counts were right. The same steps on a table with no partition key did not fail, and my results table is partitioned by day.
This is a known bug: ClickHouse issue #110604. It needs a partition key, a deduplication window and a flush in which only some inserts are duplicates. It was fixed in July 2026, and the fix is in ClickHouse 26.7 and later, including the 26.8 LTS release. It was not backported to 26.3 LTS, which is the version I run. The test that runs this case is in the Uptimepage repository.
Production already had it. With the 200 ms window, between 12 and 79 inserts or flushes a day failed with code 49, and retries recovered all of them. A 2 second window puts many more inserts in each flush. One duplicate would then fail the posts of several agents at once.
An upgrade to 26.8 LTS removes the bug. But the duplicates were also a sign that something resent rows it should not, so I looked for their source first.
The duplicates came from my agents
A duplicate means a client sent the same rows twice. My agents do resend: a POST that fails is retried with the same rows and the same batch ID. The main server keeps recent batch IDs and skips a batch it has already stored. But it records the ID only after the write succeeds. A resend that arrives while the first copy is still being written passes the check, and both copies reach ClickHouse.
So something was failing agent POSTs that had in fact arrived. The agent logs had a warning that I had read as network noise:
connection error detected: detected excessive load generating behavior (b"too_many_data_frames")
The error says "detected". In the agent's HTTP/2 library, h2, that word means the library raised the error itself, instead of receiving it from the server. Every agent was closing its own connection to the main server every 10 to 25 minutes. In about one day of logs, I counted 925 of these closes.
h2 0.4.16 added a guard against a peer that floods a connection with tiny DATA frames, the frames that carry a response body. Each small frame spends from a budget for the connection. The budget is paid back when the application reads the data.
The main server answers each results POST with 202 Accepted and a short JSON body. On success the agent never reads that body, because it only needs the status code. So each reply spent a little of the budget and never paid it back. After about 121 replies the budget was gone, and h2 closed the connection with a GOAWAY frame. On the busiest agents the closes came every 10.1 minutes: 121 posts at one every 5 seconds.
When h2 closes a connection, every request on it fails at once. That includes a results POST still waiting for its reply. The agent retries it 200 ms later, while the server is still writing the first copy. That is the duplicate.
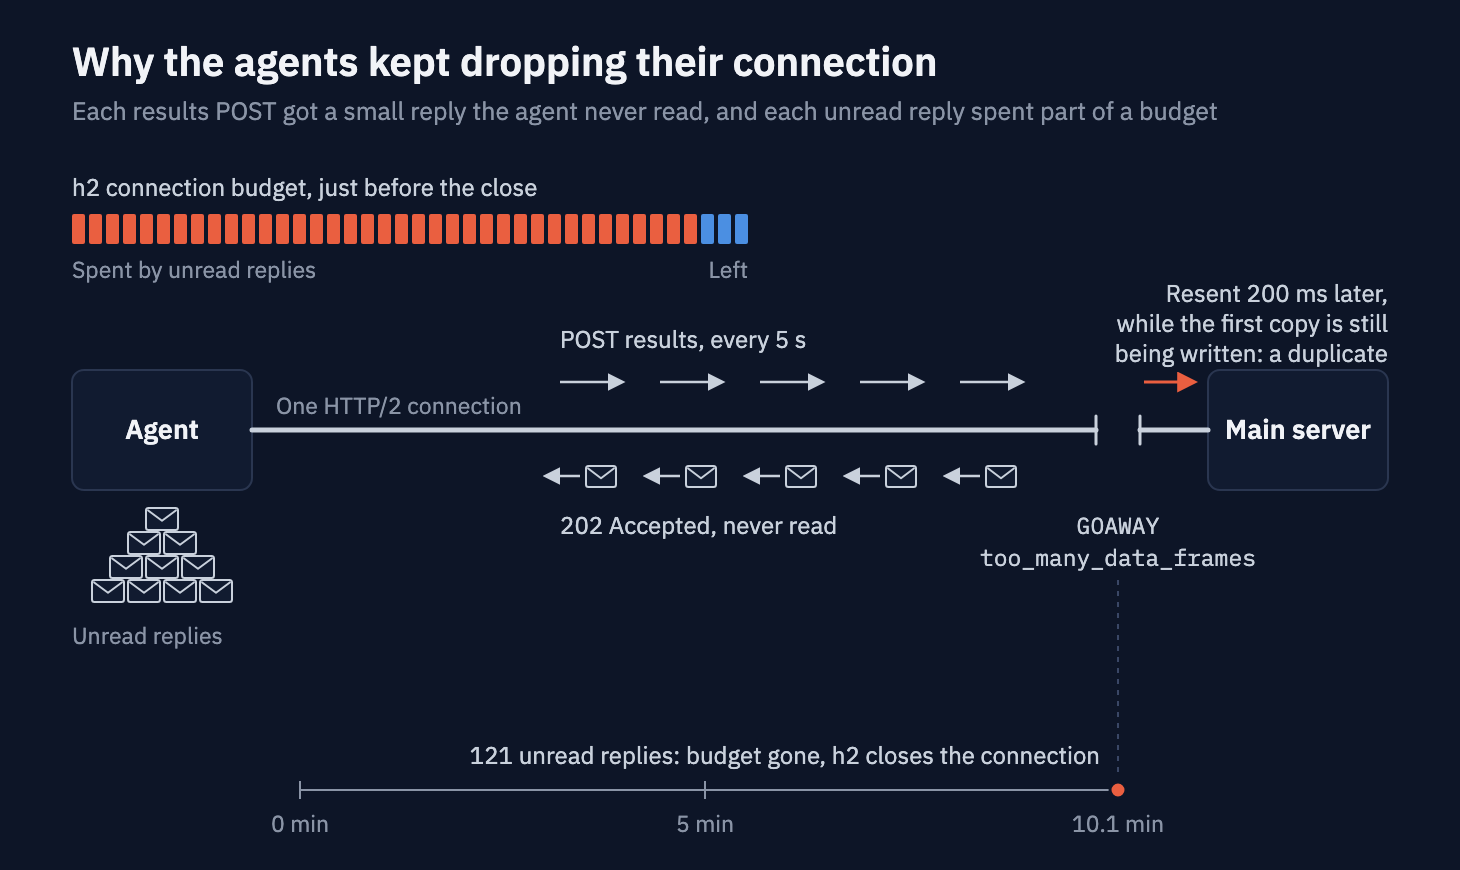
Every unread reply spent a little of the budget. At one post every 5 seconds, the budget lasted 10.1 minutes.
This is h2 issue #939. Version 0.4.17 stopped charging for the last frame of a response, and later versions made the budget larger. I moved to 0.4.20 and wrote two tests that drop 5,000 unread 202 replies on one connection. In one test the body and the end of the stream arrive in one frame, in the other in two frames. Both tests fail on 0.4.16 and pass on 0.4.20.
After I rolled out the new agents, duplicate inserts went from 136 in 12 hours to none in the next 8 hours, and code 49 errors from 40 to none.
Holding inserts, with the retries kept apart
The h2 fix removed the common source of duplicates, not every one. A network error or a timeout can still make a client resend rows that already landed. So the window needed rules. I ended up with three, and a review of my first version found that the last two, both about retries, were missing.
Only small inserts wait
An insert with 500 rows or more already makes a reasonable part, so it skips the window. Without that rule, a caller that waits for each insert could write only one batch per window.
Retries never wait, and never share a flush
A retry goes out without the window and with async_insert_max_query_number=1. That setting flushes the buffer as soon as it holds one insert, so a retry is always flushed alone. It works only while async insert deduplication is on, which it is here.
This matters because inserts that fail together also retry together:
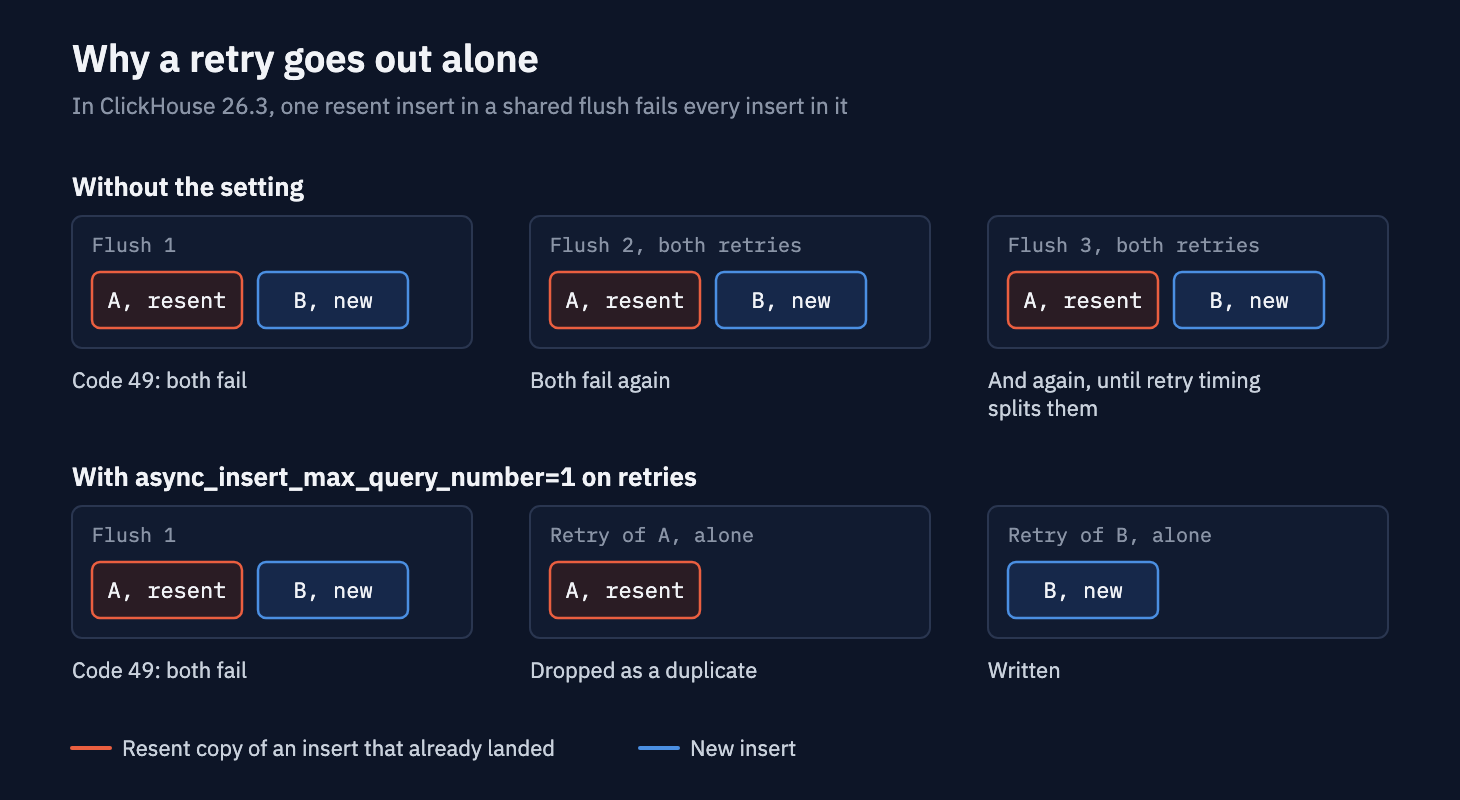
Code 49 fails every insert in the flush, so the fix is to keep each retry out of shared flushes.
I tested five resent batches and five new batches in one flush. Without the setting, the retries kept meeting in the same flush: the second round took 6.4 to 12.6 seconds, and 5 to 11 flushes failed. With it, one flush failed and the second round was done in about 2.2 seconds.
A failed batch is resent as it was
My batcher used to add new rows to a batch that had failed, then send the bigger batch. Deduplication compares the whole insert. If the first copy had committed and only its answer was lost, the bigger batch did not match it, and the old rows were counted twice. Now a failed batch is resent unchanged, and new rows wait for the next batch.
The code is public: the window and the retry rules, and the batcher change with a test that fails on the old batcher.
The result
The fixed window went live on November 14 at 07:06 UTC. The table compares the 9 hours before it, all after the h2 fix, with the 7 hours after it. Later that day I shipped a fix for reads, so the comparison stops there.
| Before | After | |
|---|---|---|
| Inserts into the results table, per second | 3.2 | 2.9 |
| Flushes of the results table, per second | 2.8 | 0.46 |
| New parts on the three result tables, per second | 8.5 | 1.4 |
| Rows per part | about 6 times as many | |
| CPU spent merging the three tables | 66% less | |
| CPU spent flushing async inserts | 78% less | |
| Average time to answer an insert | 140 ms | 1.3 s |
| Server CPU | about 77% | about 61% |
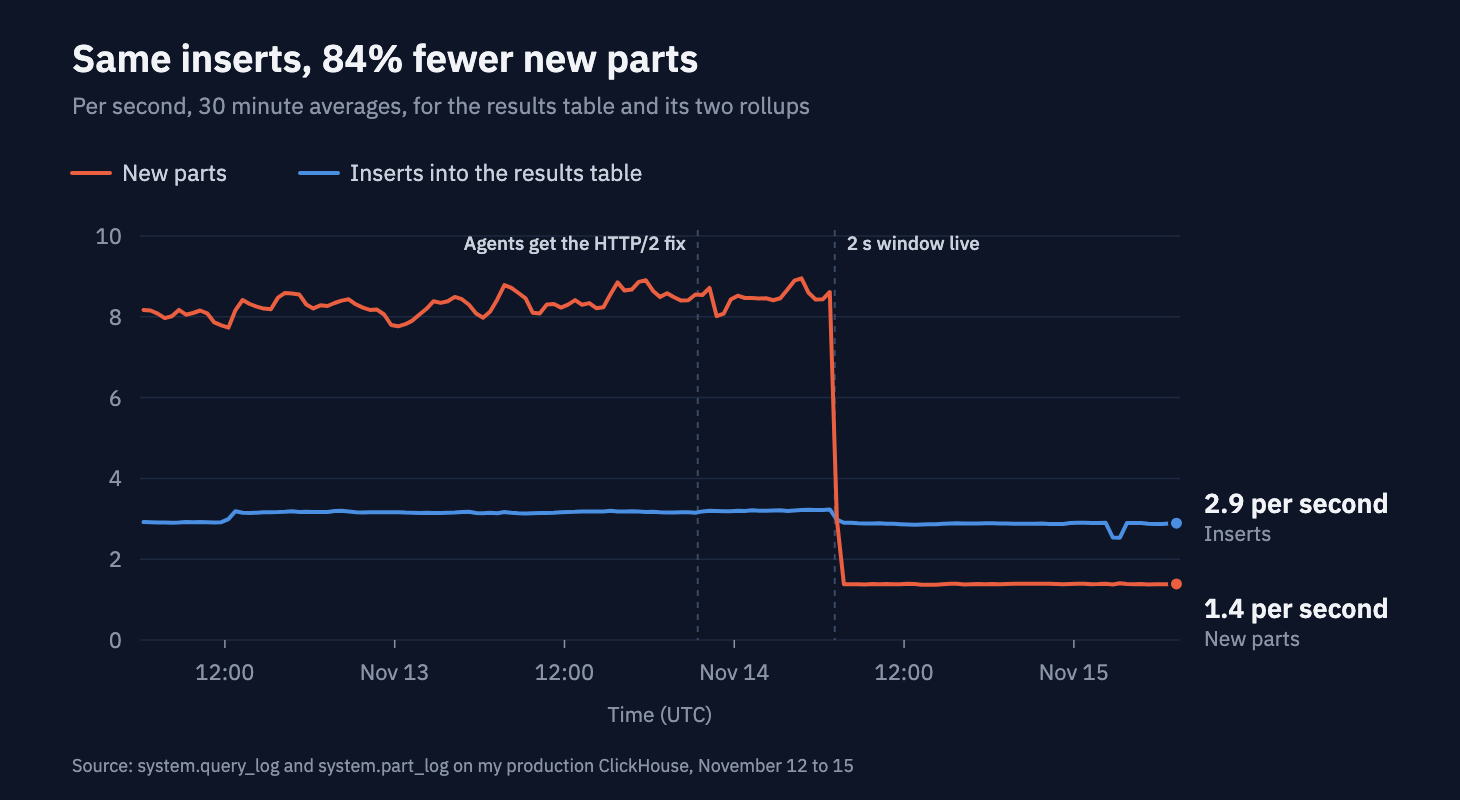
New parts did not move after the HTTP/2 fix. They fell when the window went live.
Inserts dropped a little too. The main server's own batcher waits for each write, so with a 2 second wait it sends fewer, bigger batches.
The cost is the wait. An agent now waits about 1.3 seconds for each POST to be answered, where it used to wait about 140 ms. It sends one POST every 5 seconds, so the wait fits easily.
The numbers held over the next day. Code 49 came back three times, each time when connections were cut: at two deploys and at one restart of the proxy in front of the main server. Agents resent posts that had already landed, and one or two shared flushes failed. Every insert in them went through on its own retry within two seconds, and no rows were lost.
What was left of the ClickHouse CPU was mostly reads. My incident writer read each monitor's whole lookback window again every 30 seconds, days of results for a slow monitor. I fixed that later the same day. The writer's reads now cost about a fifth of the CPU they did, and the server runs at about 50%.
How to check your own async inserts
Two queries show whether your async inserts batch. The first counts inserts and flushes per hour for one table:
SELECT
toStartOfHour(event_time) AS hour,
countIf(query_kind = 'Insert') AS inserts,
countIf(query_kind = 'AsyncInsertFlush') AS flushes
FROM system.query_log
WHERE event_time > now - INTERVAL 1 DAY
AND type = 'QueryFinish'
AND has(tables, 'your_db.your_table')
GROUP BY hour
ORDER BY hour;
If the flushes are close to the inserts, almost every insert is its own flush. The second query counts new parts per table over the last hour:
SELECT table, round(count / 3600, 2) AS new_parts_per_second
FROM system.part_log
WHERE event_type = 'NewPart'
AND event_time > now - INTERVAL 1 HOUR
GROUP BY table
ORDER BY new_parts_per_second DESC;
Each materialized view adds parts of its own. If you did not name its target table, it shows up here as .inner_id. followed by a UUID.
What I check now
- A warning that repeats at a fixed interval usually has a timer behind it. Here, 10.1 minutes was exactly 121 posts at one every 5 seconds.
- The adaptive busy timeout suits bursts. For a steady trickle of inserts, set a fixed window.
- When inserts wait in a window, keep retries out of it. A retry that shares a flush can fail its neighbours, and the neighbours retry with it.
Common questions
Why do ClickHouse async inserts create one part per insert?
At a few inserts a second, the adaptive busy timeout stays near its minimum. It only grows when inserts arrive close together, so most inserts are flushed alone and each flush writes its own part. Turn async_insert_use_adaptive_busy_timeout off for those inserts and set async_insert_busy_timeout_max_ms to the window you want.
Does raising async_insert_busy_timeout_max_ms make ClickHouse wait longer?
Not while the adaptive timeout is on. The adaptive timeout starts at async_insert_busy_timeout_min_ms and only moves toward the maximum when inserts keep arriving close together. In my test, inserts arriving about three times a second still got their answer after about 100 ms with the maximum set to 2000 ms.
What does ClickHouse "Invalid partition key size: 0" mean?
It is a known ClickHouse bug in async insert deduplication. It is tracked as issue #110604. A flush that held a resent copy of an insert that had already committed, together with any other insert, failed for all of them with Code: 49, LOGICAL_ERROR. The fix is in ClickHouse 26.7 and later, including 26.8 LTS, but not in 26.3 LTS. In my case no rows were lost: the retries went through once they landed in separate flushes.
What is too_many_data_frames in h2?
It is a guard that h2 0.4.16 added. h2 is the HTTP/2 library under hyper in Rust. Small DATA frames spend a budget for the connection, and the budget is paid back when the application reads the data. A client that drops small responses without reading them runs the budget out, and h2 closes the connection with a GOAWAY. I moved to 0.4.20, where it no longer happens.
How do I check if my ClickHouse async inserts are batching?
Count the Insert entries and the AsyncInsertFlush entries for the table in system.query_log over the same hour. If the two numbers are close, almost every insert is flushed alone. system.part_log shows the result: count the NewPart events per table.