2026-11-10
Two rejected series stalled all my metrics
- prometheus
- observability
- postmortem
- caddy
- ops
TL;DR
Three alerts fired while production was healthy. My metrics account had gone over its active series limit, because a rate limit plugin in Caddy publishes 13 series for every client address. The backend rejected a few new series in each request and stored the rest. The collector retried each whole batch anyway, so every other metric waited behind it. An allowlist fixed the series count. The rejections then continued for 20 more minutes, until the old series stopped counting as active.

One box is rejected at the gate. Every box behind it waits.
I run Uptimepage, an uptime monitoring service. It checks other people's sites, and it also reports on itself: production sends its own metrics to a hosted Prometheus backend, where my alert rules run.
One morning those metrics stopped arriving. Customer checks, incidents and notifications kept working the whole time. What I lost was my own view of the system. If something else had broken in that window, nothing would have told me.
It took me a while to find the cause, and two things about it surprised me.
Three alerts and a healthy server
Three alerts arrived close together:
- Notification sends are failing. More than a quarter failed in the last hour.
- The metrics pipeline is down. No metrics have arrived for 10 minutes.
- Caddy metrics are missing. Caddy is the web server that sits in front of everything.
The second alert fires on silence. It is the same idea as the no-data signal for probes and a heartbeat check on a cron job: something that should report has gone quiet.
I assumed production was down, logged in, and found it working. Every container was running, memory use was normal and the app answered requests. So the problem was somewhere in my monitoring.
The first clue
The metrics travel through a collector, Grafana Alloy in my case. It reads the metrics page of each service, which is called scraping. Then it sends the samples to the backend with the Prometheus remote write protocol.
Its log repeated one line, wrapped here for reading:
level=warn msg="Failed to send batch, retrying"
  err="server returned HTTP status 429 Too Many Requests:
  the request has been rejected because the tenant exceeded
  the active series limit, set to <limit>.
  1 series were rejected from this request of a total of 2000
  (err-mimir-max-active-series)"
A series is one metric name with one set of label values, and the backend allows a fixed number of active series for each account. The Mimir runbook lists this error under err-mimir-max-active-series. I was over the limit, which made no sense to me. Normally my usage is about half of it. Something had doubled it in a few hours.
Counting series
I counted what each scraped service exposes, with a short shell pipeline:
|
|
|
| |
|
It drops the comment lines, cuts each line down to the metric name, and prints how many series each name has, largest first.
Every service looked normal except Caddy, which exposed almost as many series as all the others together. More than 98% of them came from one plugin, the rate limiter, and they looked like this:
caddy_rate_limit_requests_total{key="203.0.113.7",zone="status_pages"} 5
The key label is the client address. In the plugin's metrics code, three metrics carry a zone and a key label. A rate limiter has to count requests for each address, so of course it knows the address. I had not expected it to publish metrics for each address too: a counter and a histogram. A histogram counts values in ranges called buckets. This one has ten buckets plus a sum and a count, which is 12 series.
That makes 13 series for every client address in every rate limit zone, and each new visitor added 13 more.
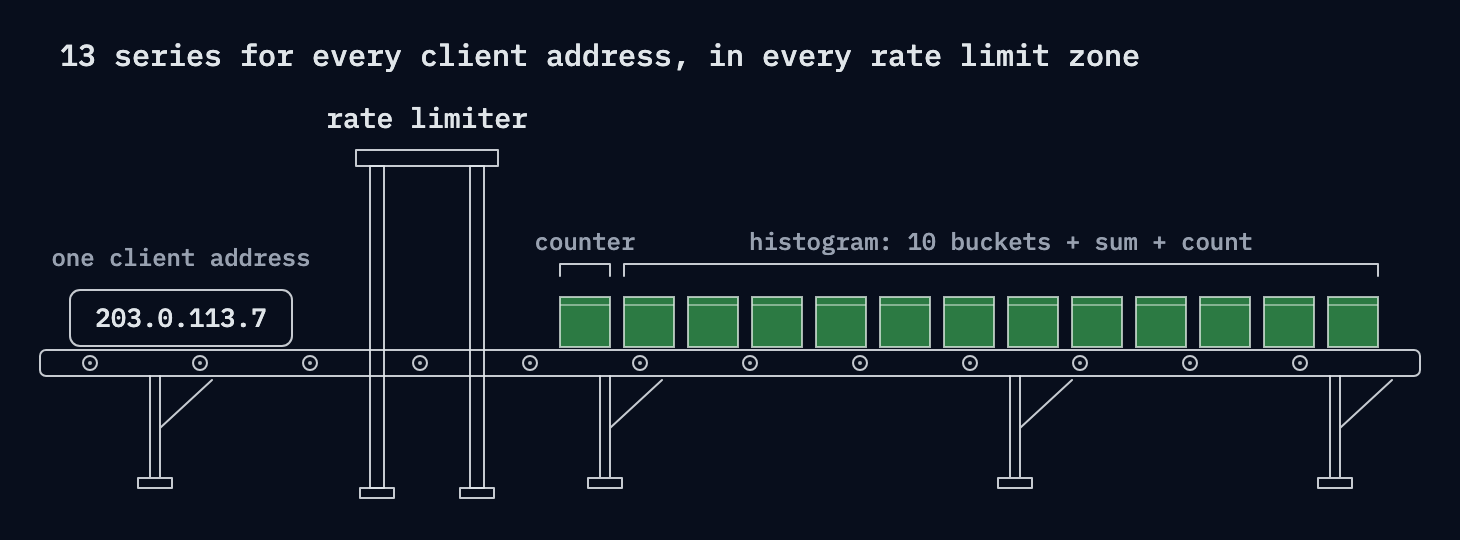
One address in, 13 series out. The plugin does this for every address in every zone.
The timing had a simple explanation. A deploy that morning had added Caddy to the list of scraped services, because I wanted one number from it: the memory use of the process. I got that number along with thousands of series I had never looked at. Six hours later the account crossed the limit.
One alert had a different cause
The first alert, about notifications, turned out to be unrelated. One webhook destination had started to answer with a bot check page and a 403 status, while every other channel delivered on the first attempt. Three alerts, then, but two separate problems that happened on the same morning.
Here is the interesting part
The error says one series was rejected out of 2000. The other 1,999 were fine, and still almost nothing was getting through.
The backend and the collector each do something reasonable here. Together they cause the stall.
The backend runs Grafana Mimir, which is open source, so I read the code. When a request would go over the limit, Mimir removes only the new series from it and stores the rest. Then it answers 429 for the whole request. I read the public code, and a hosted version can differ, but the error text matches word for word.
Alloy treats a 429 as "try again later". That is its default; plain Prometheus has the same setting and leaves it off. The remote write specification allows both and names the risk:
They MAY retry on HTTP 429 responses, which could result in senders "falling behind" if the server cannot keep up.
So Alloy kept the batch and sent it again. The server accepted the same 1,999 series again, rejected the same one, and answered 429 again.
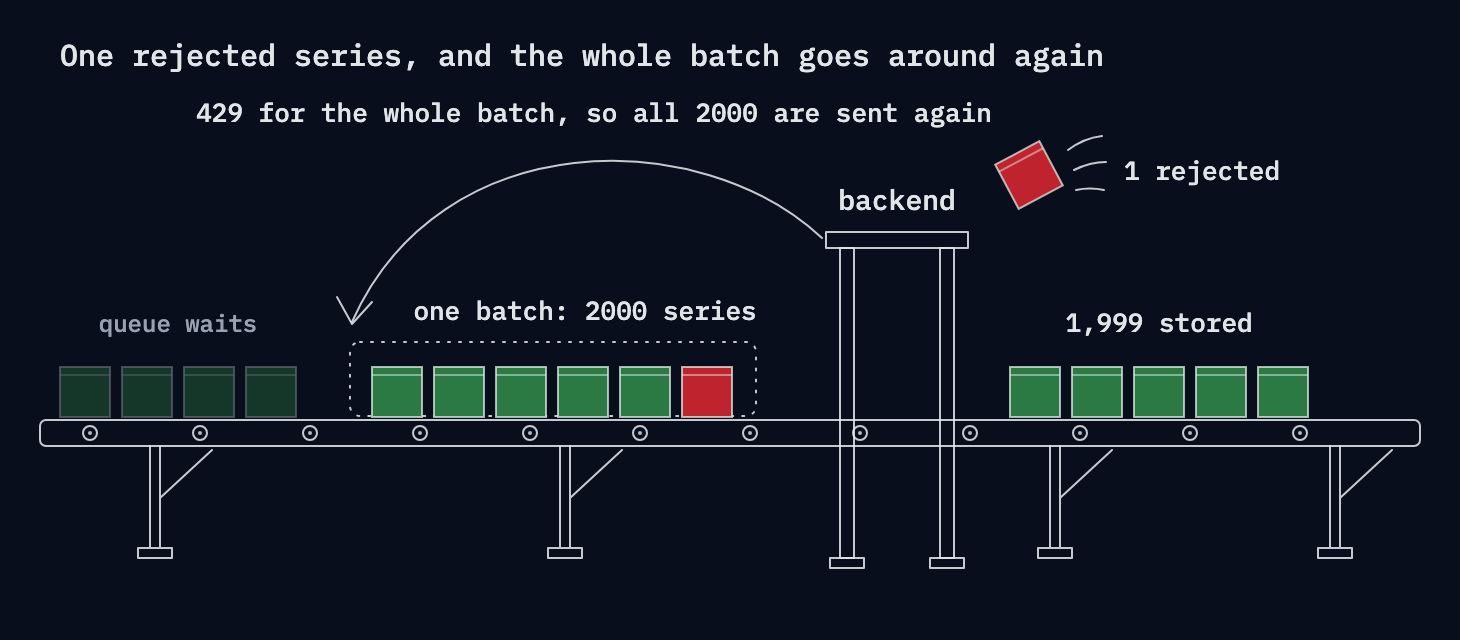
The backend keeps 1,999 series and still answers 429. The collector sends all 2000 again.
While one batch is being retried, the queue behind it waits. Alloy also stops adding parallel senders while it sees errors it can retry. A few rejected series were enough to hold back every other metric I send. About one batch got through every minute and a half, and new samples arrived several times faster than that. The dashboards fell further behind every minute.
The odd result is that the server had accepted nearly all of the data on the first attempt. The retries were what held everything else back.
The fix
Since I only wanted one number, I now send a short list of metrics from Caddy and drop the rest. In Alloy that is a relabel step with a keep rule:
prometheus.scrape "caddy"
prometheus.relabel "caddy"
}
One detail is easy to miss. The scraper adds its own series, up and a few named scrape_..., and they pass through the same filter. An allowlist that names only process_.* drops up as well, so an alert on up would fire for a healthy service. I checked this with a second test and those series did not arrive, which is why they are on the list.
Before touching production I tested the change with a fake metrics page full of made-up addresses, the real collector, and a local Prometheus as the receiver. Only the listed series arrived, so I applied it.
Here is the second interesting part
The fix appeared to do nothing. The collector still got 429, with two series rejected in every batch, and the delay grew to 5 minutes, then 10, then 14.
The per-address series were no longer being sent, but the backend still counted them. Its documentation says a series is active if it received a sample in the previous 20 minutes, and 20 minutes is also the default idle timeout in Mimir's usage tracker. Until that time passed, the account stayed over the limit. Any series that was new was still rejected, and each rejection still blocked the queue.
I could only wait. I did consider turning off the retry on 429 as a second step, but it was not needed.
The last per-address sample reached the backend at about 11:49 UTC, and the last rejection came at 12:08:46. Two minutes later the queue was empty and 15 minutes of waiting samples had been sent. Nothing was lost, because the collector keeps samples in a write-ahead log on disk until they are delivered.
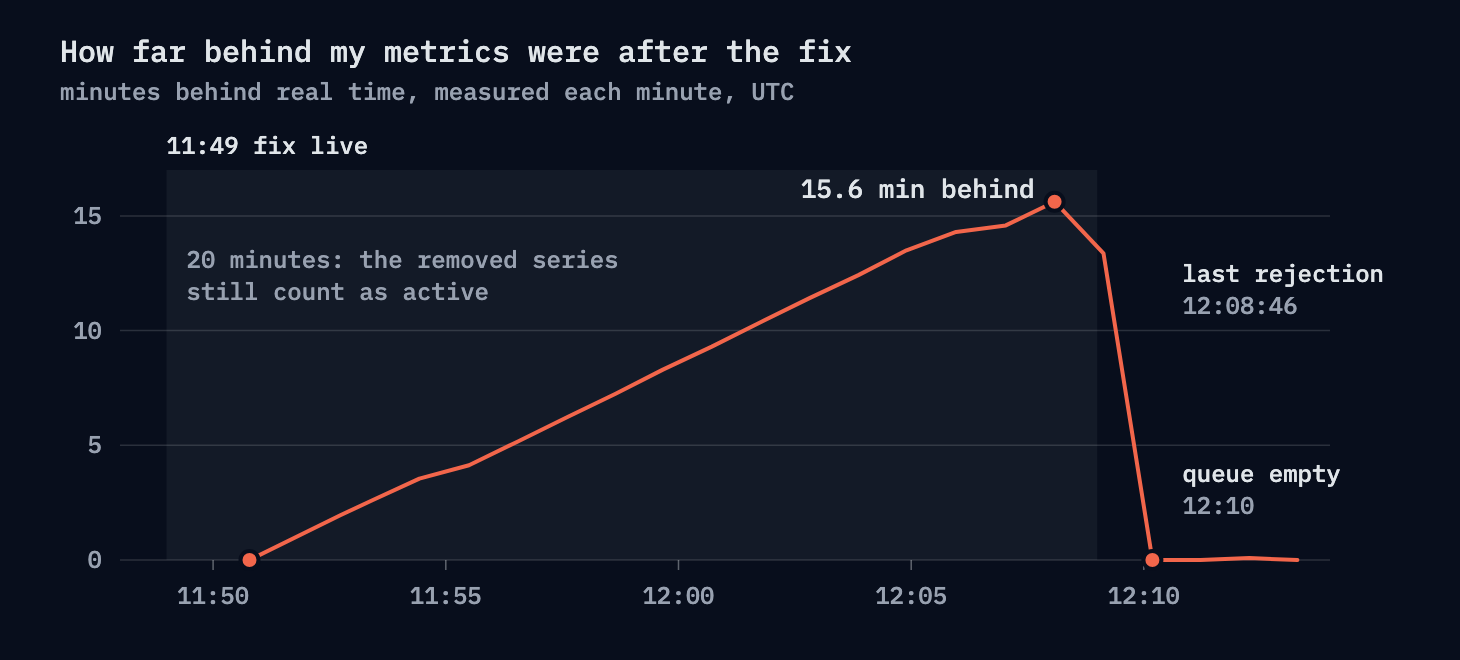
Measured once a minute. The delay grew for 20 minutes and was gone two minutes later.
The timeline, in UTC:
- 04:41 a deploy adds the Caddy scrape
- 10:50 the first rejection
- 11:34 I start looking
- 11:49 the fix is live
- 12:08 the last rejection
- 12:10 the queue is empty
What I took from it
Count the series before you scrape a new service, and read the label names while you are there. A label that holds an address, a user ID or a URL can grow without a limit. The Prometheus documentation says not to put unbounded values in labels.
For metrics from software you did not write, use an allowlist. A deny list can only name the metrics you have already seen.
A 429 can mean "I stored most of this". Find out what your backend does with a partly rejected request before you let the client retry it forever. I still kept the retry on. A real rate limit also answers 429, and those samples should be sent again.
After you remove series, the backend goes on counting them for its active window, which is 20 minutes for mine. Wait that long before you decide the fix did not work.
Alert on your active series against the limit. The backend publishes that number as a metric, and I had no alert on it. It is the same gap as in the ClickHouse disk incident: I watched the effect and had no alert on the resource that ran out.
Keep scrape_samples_scraped on the allowlist. It counts what the service exposes before the filter runs, so I can still watch that number grow without sending the series themselves.
Common questions
What does err-mimir-max-active-series mean?
The account has more active series than its limit allows, so the backend rejects series that are new. Series that are already active are still accepted. The error also says how many series in the request were rejected.
Does Mimir store the rest of a request when it answers 429 for the active series limit?
In the open source code it does. Mimir removes only the series that would go over the limit, stores the others, and then answers 429 for the whole request. A hosted version can differ from the public code.
Why does Grafana Alloy stop sending metrics after a 429?
Alloy retries a batch that gets a 429, because retry_on_http_429 is on by default. If the same series is rejected every time, the batch is sent again and again and the samples behind it wait. Prometheus has the same setting and leaves it off.
How long do removed series keep counting toward the active series limit?
For as long as the backend's active window. In my case a series counted as active for 20 minutes after its last sample, and the rejections stopped about 20 minutes after I stopped sending the series.