2026-11-15
Caddy ran out of memory, and the heap was not the problem
- caddy
- go
- debugging
- postmortem
- ops
TL;DR
At 02:31 one night, Caddy, the reverse proxy in front of my service, grew from 94 MiB to its 1 GiB memory cap in under three minutes. The access log showed a scanner that had sent about a thousand requests in five seconds, so the case looked closed. It was not. When I replayed those exact requests in a lab, memory did not move. Caddy's own Go metrics told a different story: the heap stayed small, and goroutine stacks grew past 2 GiB. Goroutines stuck inside a TLS library were holding it. The bug was in certmagic and is fixed upstream. Caddy 2.11.9 does not grow at all under the test that grows 2.11.4.
02:31:35, the suspect
I run Uptimepage, an uptime monitoring service. Caddy sits in front of everything: the app, the public status pages and the custom domains that customers point at their status pages, which use on-demand TLS.
The night started with a swap alert. Another post explains why a memory cap that should have contained this did not. This post is about the other question: why did Caddy need that much memory at all?
Caddy's process metrics gave a clear start time. Before 02:31:30, Caddy used between 75 and 98 MiB, as it had for days. Thirty seconds later it used 733 MiB. Two minutes after that it sat at 999 MiB, right under its cap.
The access log for that minute had an obvious suspect (simplified, with the address replaced):
02:31:35  203.0.113.7  GET /cookies.zip   Range: bytes=0-3  Connection: close  404
02:31:35  203.0.113.7  GET /emailing.zip  Range: bytes=0-3  Connection: close  429
...       (1018 requests in 5 seconds, all from one address)
A scanner was looking for backup files on one of the custom domains. It sent 1018 requests in five seconds. My rate limiter answered 958 of them with 429, and the other 60 reached the app and got a 404. The burst started at 02:31:35. The memory jumped right after it. The case looked closed.
The alibi
I wanted to see it happen, so I built a lab. I compiled the same Caddy version (2.11.4) with the same two plugins using xcaddy, copied the production config for the custom domains word for word, gave the container the same 1 GiB cap and put a small fake app behind it. Then I replayed the scanner: 1018 requests over five seconds, each on a new TLS connection, with the same headers and the same Connection: close.
The rate limiter gave the same answer as in production: 959 times 429 and 59 times 404. Memory did not care.
| Production, 02:31 | Lab replay | |
|---|---|---|
| Requests | 1018 in 5 s | 1018 in 5 s |
| Answered 429 / 404 | 958 / 60 | 959 / 59 |
| Caddy memory after | 94 MiB to 733 MiB | 49 MiB to 56 MiB |
| Goroutines after | 211 to 2189 | 37 to 82 |
I tried the variations I could think of. I ran it against Pebble, a local ACME test CA, so the certificate renewal checks that production logged in that minute ran in the lab too. Nothing grew. The scanner's requests had an alibi.
The number that did not fit
Production gained about 2000 goroutines in 20 seconds. The scanner had sent 1018 requests, and every one of them had already finished, most in under a millisecond. Something else had opened about 2000 connections, and it had not left a single line in the access log.
The number nobody graphs
Caddy exposes the standard Go runtime metrics, and I had started to collect them a few days earlier. I had a panel for heap memory and nothing else. So I went back to the raw series for that night and split the memory by kind.
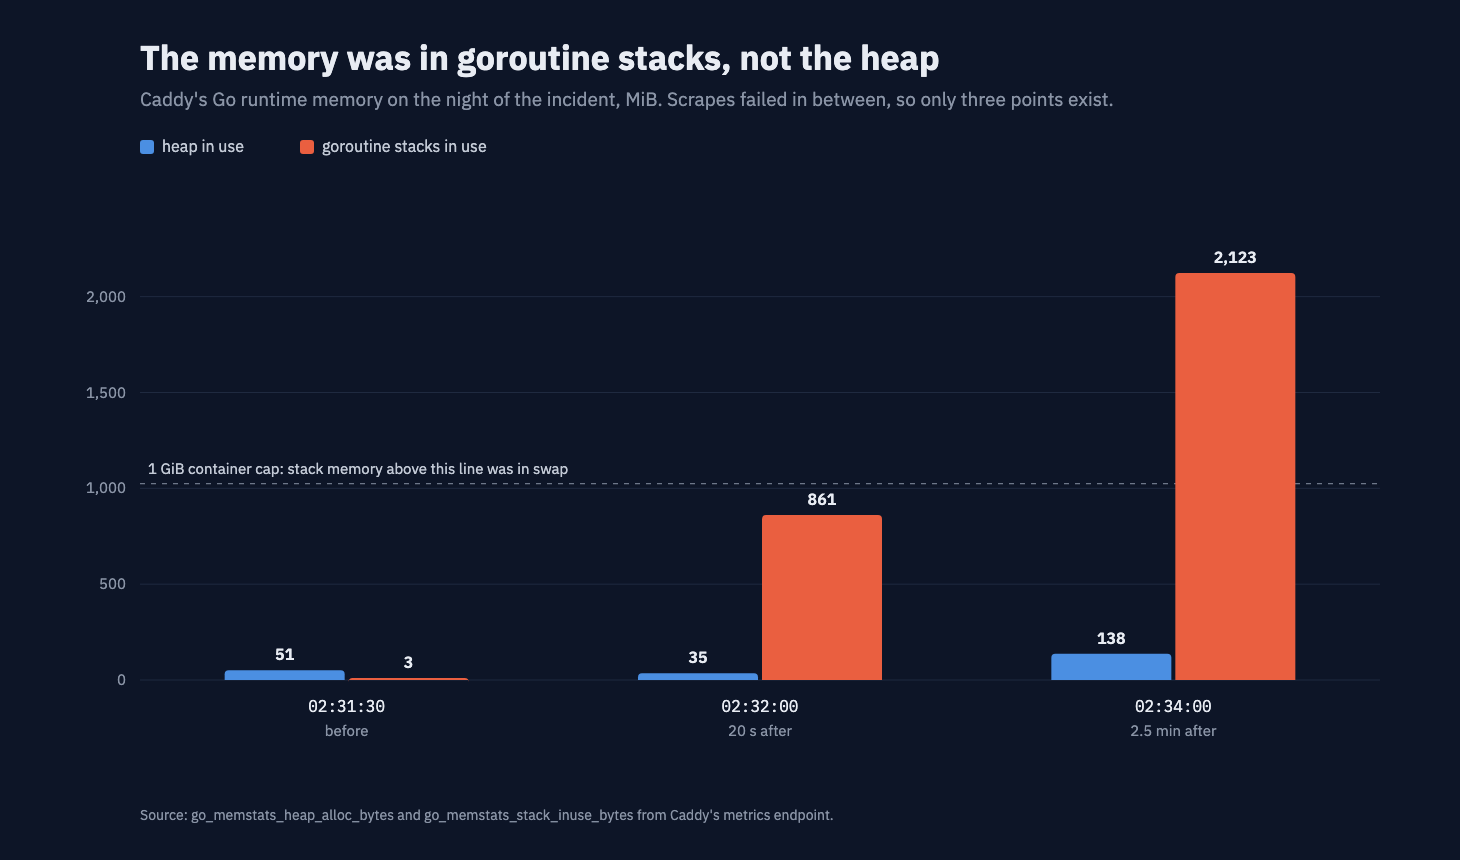
The heap barely moved. Goroutine stacks went from 3 MiB to more than 2 GiB.
The heap went from 51 MiB to 35 MiB, and later to 138 MiB. Goroutine stacks went from 3 MiB to 861 MiB in 30 seconds, and to 2,123 MiB two minutes later. The number of goroutines stayed flat between those two points, at about 2100. So the same goroutines were using more and more stack.
The process also had 2063 open file descriptors at 02:32, against 86 before. One file descriptor and one goroutine per connection: about 2000 connections, all open, all with growing stacks.
Goroutine stacks are memory too
A goroutine starts with a small stack: 2 KiB by default, and since Go 1.19 the runtime sizes it from the average stack use. When a call chain needs more, Go copies the stack to a block twice the size. An idle connection in Caddy keeps its stack at 8 to 16 KiB. These connections averaged about 1 MiB each, and they kept growing. A stack only grows like that when a call chain gets deeper and deeper, and does not return.
To be sure that open connections alone could not do this, I held a thousand idle TLS connections open against the lab Caddy for 50 seconds. Stacks grew from 1 MiB to 17 MiB in total, and fell back when the connections closed. Idle connections are cheap, so production's connections were doing something else. They were stuck deep inside some call chain.
Connections that never say a word
The access log records a request when the request is done. A connection that has not sent a complete request never appears in it. So the log could show me the scanner, but not the connections that actually held the memory.
A different kind of test traffic did reproduce the growth in the lab, and every stuck goroutine was in Caddy's TLS code, inside the certmagic library. I did not need a profile from production any more. I needed to read certmagic.
Down in the library
Caddy 2.11.4 ships certmagic v0.25.3. That version has a bug in its handshake code: in some error cases, a goroutine that waits for a result calls the same function again instead of returning, one level deeper each time. Every round leaves a frame on its stack. That matches everything the metrics showed: a flat goroutine count, stacks that grow over minutes and a heap that hardly moves.
Upstream had already fixed it. Certmagic pull request 387 was merged in June and shipped in certmagic v0.25.4. Every Caddy release since 2.11.5 carries v0.25.6. My image was built on 2.11.4.
The lab, round two
A changelog entry is not a measurement, so I built Caddy 2.11.9 with the same plugins and ran that reproducing test against both versions, with the same config and the same cap.
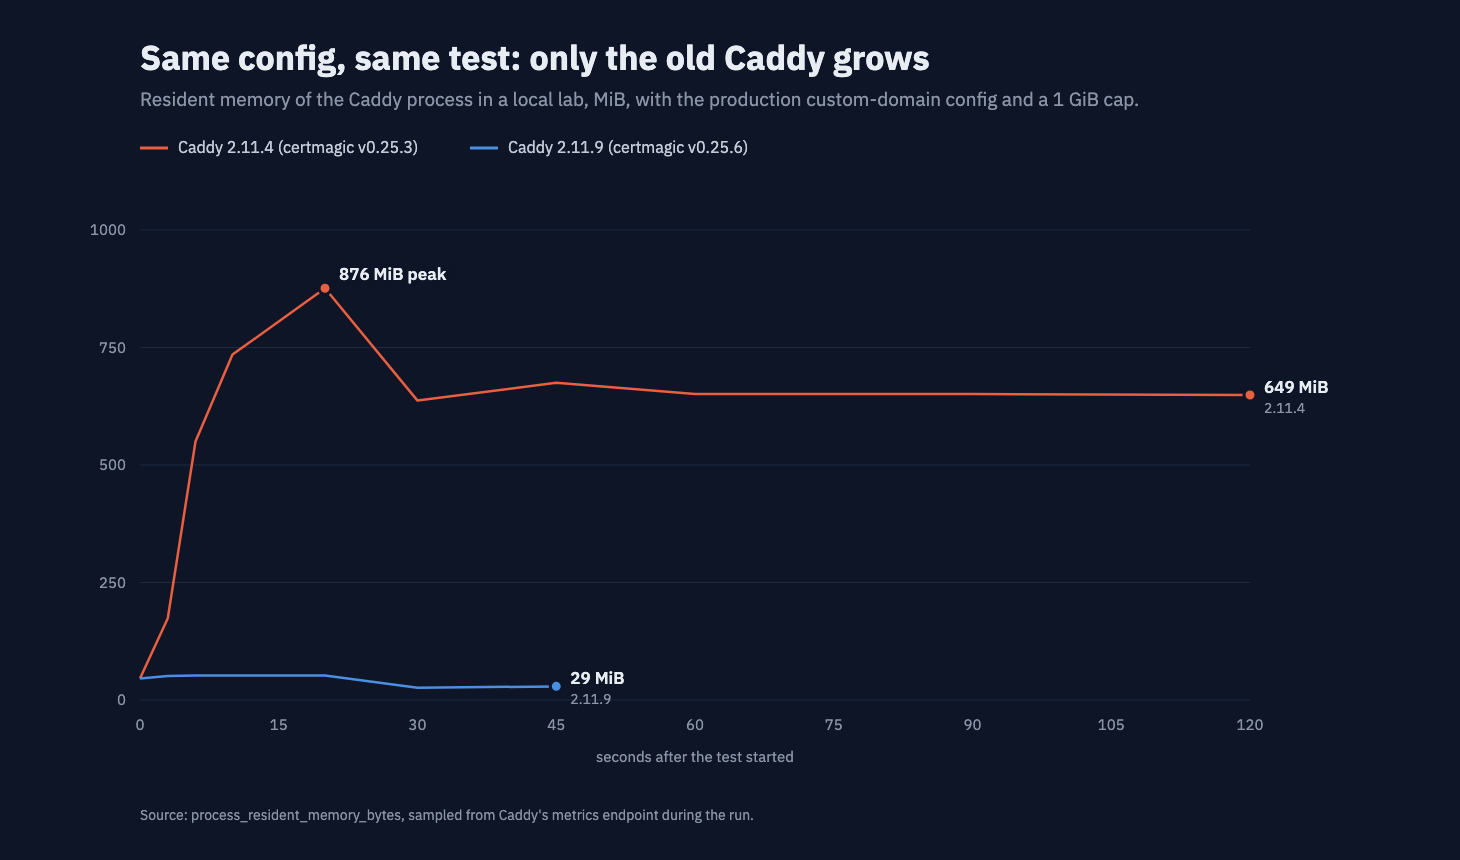
Same config, same 1 GiB cap, same test. Only the old version grows.
| Caddy 2.11.4 | Caddy 2.11.9 | |
|---|---|---|
| certmagic | v0.25.3 | v0.25.6 |
| Peak resident memory | 876 MiB | 52 MiB |
| Peak goroutine stacks | 1,027 MiB | 1 MiB |
| Memory after all connections closed | about 650 MiB | 29 MiB |
The last row surprised me most. On 2.11.4, after every connection had closed and the goroutine count was back to normal, the process still held about 650 MiB. The Go runtime did not give that memory back to the system during the test. So a burst can leave Caddy bigger than before, even after the burst is over.
The fix
The fix was a version pin, plus a new image tag. My Caddy image used the floating caddy:2 base images, which meant "whatever 2.x existed on the day I built it". I pinned the version to 2.11.9 instead:
ARG CADDY_VERSION=2.11.9

FROM caddy:${CADDY_VERSION}-builder AS builder
RUN xcaddy build \
    --with github.com/mholt/caddy-ratelimit@5625512f24f6f59d6f64fb3aafe5eecff0b286db

FROM caddy:${CADDY_VERSION}-alpine
COPY --from=builder /usr/bin/caddy /usr/bin/caddy
I also bumped the image tag, because my deploy rebuilds Caddy only when the tag changes.
Between 2.11.4 and 2.11.9, Caddy added default idle timeouts of one minute for reading request bodies and writing responses. My app has requests that wait up to 145 seconds for an answer, and MCP clients keep streams open. So before I shipped, I tested both cases on 2.11.9 in the lab:
| Test on 2.11.9 | HTTP/1.1 | HTTP/2 |
|---|---|---|
| POST with a body, upstream answers after 90 s | 200 after 90 s | 200 after 90 s |
| SSE stream with a 90 s pause between events | both events arrived | both events arrived |
Waiting for the upstream and pausing between writes do not count as a stall. The full production Caddyfile also passed caddy validate on the new version, so none of the stricter config checks in the new releases applied to it.
After the deploy, production reported Caddy v2.11.9 with certmagic v0.25.6, using 37 MiB.
Check your own Caddy
The two-minute test
If you use on-demand TLS, check which certmagic your Caddy binary carries:
|Anything older than v0.25.4 has the bug. Caddy 2.11.5 and later are fine. If you build Caddy with xcaddy from a floating base image, the answer depends on the day you built it.
If you collect Caddy's metrics, add one more line to your memory panel:
go_memstats_stack_inuse_bytes{job="caddy"}This is the Go runtime's
StackInusecounter, exported by the Prometheus Go client. In normal operation it is a few MiB. If it ever grows faster than the heap, look at goroutines and connections before you look at allocations.
What I took from this
Key takeaways
- The access log only knows about finished requests. Connections that never get that far can hold all of the memory and leave no trace there.
- A replay of the obvious suspect is cheap, and it can clear the suspect in an hour. Mine did.
- In Go, the heap is only one part of the memory. Graph
go_memstats_stack_inuse_bytesnext to it, or a stack leak stays invisible.- Flat goroutine count plus growing stacks means calls that go deeper and do not return.
- Pin the base image of software you build yourself. A floating tag gave me a version that was older than its own fix.
The scanner did send a thousand requests, and they cost almost nothing. The memory went to connections that never sent a request at all.
Common questions
How do I tell if a Go program's memory is in the heap or in goroutine stacks?
Compare go_memstats_heap_inuse_bytes (or heap_alloc) with go_memstats_stack_inuse_bytes. Both come with the standard Go metrics in Prometheus format. Most dashboards only graph the heap. If the stack number grows while the heap stays flat, look at goroutines, not at allocations.
Which Caddy versions have the certmagic handshake bug?
Caddy 2.11.4 and older ship certmagic v0.25.3 or older. The fix is in certmagic v0.25.4 (pull request 387), and every Caddy release from 2.11.5 on carries certmagic v0.25.6. The bug matters for sites that use on-demand TLS. Run caddy build-info and check the certmagic line.
Why did the access log not show the traffic that used the memory?
Caddy writes an access log line when it finishes a request. A connection that has not sent a complete request never produces a line. In my case such connections held the memory, and the access log only showed the requests around them.
Does upgrading Caddy to 2.11.9 cut off long requests or SSE streams?
Not in my tests. Caddy 2.11.6 added default idle read and write timeouts of one minute. A POST that waited 90 seconds for the upstream and an SSE stream with a 90 second pause both completed on 2.11.9, over HTTP/1.1 and HTTP/2. The timeouts count stalls in the middle of a read or a write, not waiting for the upstream or pauses between writes.